

Cybersecurity ROI is measurable through the Return on Security Investment formula: divide expected loss avoided minus control cost by control cost. The math runs on three inputs you already have access to: realistic incident scenarios, their dollar impact, and how much a given control reduces the odds or size of that impact. This article walks through the key concepts, an example calculation, and how to present the result effectively to executives.
TL;DR:
- Fixed controls cost typically lead to payback periods of just a few months when using ALE and ARO data in a clear ROI calculation.
- Using a three-case scenario—conservative, base, and optimistic—addresses uncertainty and improves credibility with executive stakeholders.
- Operational metrics such as mean time to detect, patch compliance, and phishing click rates directly influence the model's dollar inputs like SLE and ARO.
- It's crucial to translate technical improvements into measurable risk reductions with a simple lookup table linking NIST outcome categories to ALE inputs.
- A fully transparent, editable model with validated data and scenario ranges increases trust and makes it easier for CFOs to approve cybersecurity investments.
Table of Contents
- What Is Cybersecurity ROI and How Do You Calculate It?
- FAIR vs. NIST: Choosing the Right Framework for Your Inputs
- Building a Stress-Tested ROSI Model the CFO Won't Reject
- The Metrics and Data Sources That Feed the Model
- Presenting the Model So the CFO Says Yes
- Where ROSI Models Break Down and How to Fix Them
- How a vCISO Turns This Model Into a Repeatable Practice
- Why Transparent Models Beat Fear-Based Pitches
- Get a Defensible ROSI Model Built for Your Organization
- Sources
- FAQ
What Is Cybersecurity ROI and How Do You Calculate It?
Return on Security Investment, or ROSI, is the standard formula for cybersecurity ROI. It compares the expected loss you avoid by deploying a control against what that control actually costs.
ROSI = (expected loss avoided minus cost of control) divided by cost of control
Three variables feed that formula, and each has its own name in risk-quantification literature:
- SLE (Single Loss Expectancy) — the dollar cost of one occurrence of the incident (ransomware payout plus downtime, a regulatory fine, breach notification costs).
- ARO (Annualized Rate of Occurrence) — how many times you expect that incident type per year, based on your industry, threat intelligence, and internal incident history.
- ALE (Annualized Loss Expectancy) — SLE multiplied by ARO. This is your baseline annual risk exposure before any new control.
Here's a worked example using a mid-size law firm facing business email compromise attempts.
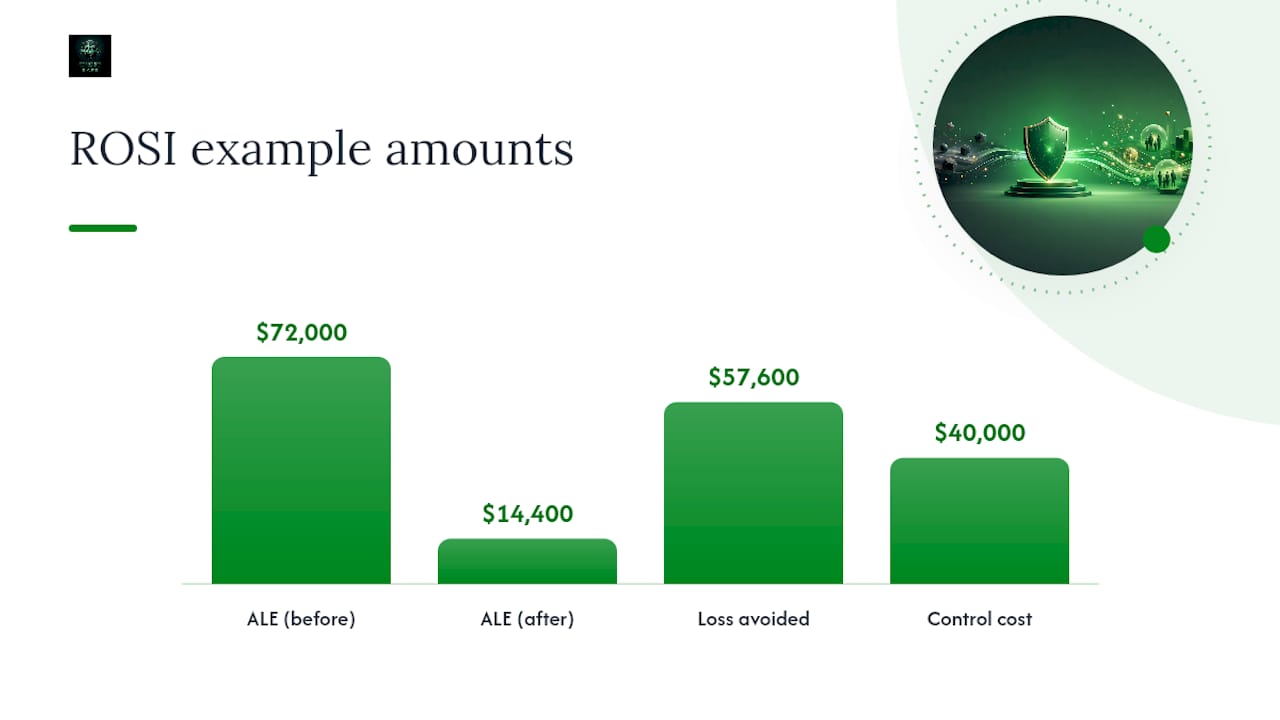
Status quo (no new control): SLE = $180,000 (wire fraud loss, client notification, reputational cleanup). ARO = 0.4 (roughly one incident every 2.5 years, based on the firm's phishing click data). ALE before = $180,000 × 0.4 = $72,000.
After deploying a control (email authentication, phishing simulation training, and transaction verification workflows costing $40,000 fully loaded): ALE after = $180,000 × 0.08 = $14,400.
Expected loss avoided = $72,000 − $14,400 = $57,600.
Payback period = cost ÷ annual loss avoided = $40,000 divided by $57,600, approximately several months.
It's a number built from inputs a CFO can interrogate line by line, which is the entire point of using ROSI instead of a vendor's marketing deck. When you separate direct costs (software, staffing, consulting fees) from indirect costs (productivity loss during rollout, training hours, integration overhead), the model holds up better under scrutiny. A quantitative risk assessment that documents both cost categories up front saves you from having to defend gaps later.
FAIR vs. NIST: Choosing the Right Framework for Your Inputs
ALE gets you a directional number fast. FAIR gets you a defensible one when the stakes or the audience demand more rigor. Knowing when to reach for each is what separates a credible model from a spreadsheet nobody trusts.
- Use straight ALE math for lower-value, high-frequency scenarios like phishing or routine malware, where speed matters more than precision.
- Use the FAIR model for complex, high-value scenarios, ransomware against critical infrastructure, third-party breach exposure, or board-level capital requests, because FAIR separates frequency and magnitude into distinct probability distributions rather than single-point estimates.
- Use NIST CSF 2.0 to structure which outcomes you're even measuring. The framework's functions and categories give you a taxonomy for translating "we patched faster" into an outcome a CFO recognizes.
- Use NIST SP 800-55 to select the actual measures. It's built specifically for developing measurement programs that produce quantifiable inputs for resource allocation decisions, which maps directly onto your ARO and control-effectiveness assumptions.
The conversion step is where most models fall apart. A control that "improves detection coverage" means nothing to a CFO until you translate it: coverage improvement reduces ARO by an estimated percentage, which flows into ALE after, which flows into ROSI. Every technical metric needs that same three-hop translation before it belongs in a financial model. NIST CSF alignment gives you the outcome categories; you still have to do the dollar conversion yourself.
Pro Tip: Build a simple lookup table that maps each NIST CSF outcome to a specific ALE input (frequency, magnitude, or both). It turns "we improved our Detect function" into "ARO dropped from 0.4 to 0.08" in one step instead of a debate.
Building a Stress-Tested ROSI Model the CFO Won't Reject
A single ROSI number invites a single objection. A model with a conservative, base, and optimistic case invites a conversation instead, and that conversation is where budget approvals actually happen. CFOs consistently favor models with editable, benchmarked assumptions over static, take-it-or-leave-it figures.
Here's the sequence to build one:
- Define the scenario in plain language. "Ransomware encrypts production file servers, forcing 3 days of downtime" beats "malware event" every time.
- Set ARO from real data. Pull from internal incident logs, cyber insurance claims history, or industry benchmarks. Don't estimate from memory.
- Set SLE with a full cost breakdown. Include downtime revenue loss, incident response fees, legal and notification costs, and any regulatory exposure.
- Calculate ALE before. SLE × ARO, using your status quo numbers.
- Estimate control effectiveness. What percentage does the control reduce frequency, magnitude, or both? Base this on pilot data or vendor-validated benchmarks, never a sales claim alone.
- Calculate ALE after. Apply the effectiveness estimate to get your post-control exposure.
- Calculate expected loss avoided, ROSI, and payback period. Use the formulas above.
- Run three cases. Conservative (low effectiveness, low ARO reduction), base (your best estimate), and optimistic (upper bound from benchmark data).
- Calculate a break-even point. What's the minimum effectiveness percentage at which the investment still pays for itself? This single number often does more to win over a skeptical CFO than the headline ROSI figure.
- Extend to multi-year net ROI if the control has ongoing licensing or staffing costs, so the payback period reflects total cost of ownership, not year-one only.
Running the earlier law firm example through all three cases illustrates why this matters.
Expected-loss avoided is the core value driver CFOs respond to, and presenting it as a range rather than a point estimate signals that you understand uncertainty rather than hiding from it. Every input in this sequence should live in an editable spreadsheet or model file you hand over, not a locked PDF. A CFO who can change the ARO assumption and watch the ROSI recalculate trusts the number far more than one who has to take your word for it.
The Metrics and Data Sources That Feed the Model
Your ROSI model is only as good as the inputs underneath it, and most of those inputs come from metrics your security team already tracks. The trick is translating operational numbers into the dollar figures that feed ALE and SLE.
Start with the operational side, understanding how a cybersecurity maturity model helps prioritize investments in these key metrics. Mean Time to Detect (MTTD) and Mean Time to Respond (MTTR) directly affect SLE, because longer dwell time means more data exfiltrated, more systems affected, and higher recovery costs. Patch SLA compliance rates and vulnerability backlog size affect your ARO, since unpatched systems raise the likelihood of exploitation. Phishing simulation click rates give you a defensible baseline ARO for business email compromise and credential theft scenarios. Ticket volume and severity trends round out the operational picture.
On the financial side, you need revenue per hour or per day of downtime, fully loaded headcount costs for incident response staff and hours diverted from other work, and estimated forensic, notification, and legal costs per incident type. Cyber insurance coverage limits and deductibles matter too, since they cap your realistic loss exposure and shift part of the calculation.
| Input category | Example metric | Feeds into |
|---|---|---|
| Detection speed | MTTD, MTTR | SLE (dwell time drives cost) |
| Patch hygiene | SLA compliance %, backlog size | ARO (unpatched exposure) |
| Human risk | Phishing click rate | ARO (BEC and credential theft) |
| Downtime cost | Revenue per hour/day | SLE (direct cost) |
| Response cost | Fully loaded IR headcount | SLE (direct cost) |
| Legal exposure | Forensic, notification, legal fees | SLE (direct cost) |
For benchmark data when internal history is thin, the IBM Cost of a Data Breach Report remains a defensible reference point, though you should always adjust its figures to your organization's size, industry, and geography rather than applying them as-is. Continuous monitoring practices also generate the incident-frequency data that makes your own ARO estimates far more credible than industry averages alone.
Presenting the Model So the CFO Says Yes
The security team that gets budget approved isn't the one with the scariest slide. It's the one with the most defensible number, presented in language finance already speaks.
Lead every presentation with four figures: the headline expected loss avoided, the payback period, the sensitivity band (conservative to optimistic ROSI), and a one-line cost-of-inaction statement tied to a specific scenario. Skip the technical metrics entirely in the opening slide. Save MTTD and patch compliance for the appendix, where a technically curious CFO or board member can dig in if they want to.
Three visuals do most of the work:
- A waterfall chart showing ALE before, the reduction from the control, and ALE after, ending at expected loss avoided.
- A payback timeline plotting cumulative savings against the initial investment until the breakeven point.
- A three-case scenario table (conservative, base, optimistic) rather than a single number, so the range itself demonstrates rigor.
Come prepared for pushback. Bring the editable model file, not a static export. Cite your benchmark sources by name, whether that's IBM's breach report or your own insurance claims history. If you piloted the control before full deployment, bring that validation data, since pilot results carry far more weight than vendor claims. And address insurance directly: a control that lowers your risk profile can also lower premiums or unlock better coverage terms, which is a real dollar benefit that belongs in the model, not just a footnote.
Pro Tip: If your CFO has ever rejected a security budget request, ask what specifically they didn't trust about the number. Nine times out of ten it's the lack of a range, not the size of the ask.
Where ROSI Models Break Down and How to Fix Them
Most ROSI models fail credibility review for the same handful of reasons, and every one of them is fixable before you walk into the room.
- Claiming prevented breaches as fact. You can't prove a negative. Frame everything as probability-weighted expected loss, not "this control stopped an attack."
- Locked, non-editable assumptions. A PDF with a single ROSI number invites suspicion. Hand over the working file and let finance change the inputs themselves.
- Skipping the conservative case. Presenting only your best-case scenario reads as salesmanship, not analysis. Always show the floor.
- Trusting vendor effectiveness claims without validation. A vendor's "reduces risk by 90%" figure needs pilot data or third-party testing behind it before it goes into your model.
- Ignoring insurance and residual risk. If a loss is partially covered by your cyber policy, your net exposure is smaller than the gross SLE. Model both figures, and separately account for reputational damage that insurance can't touch and that a policy payout doesn't erase.
How a vCISO Turns This Model Into a Repeatable Practice
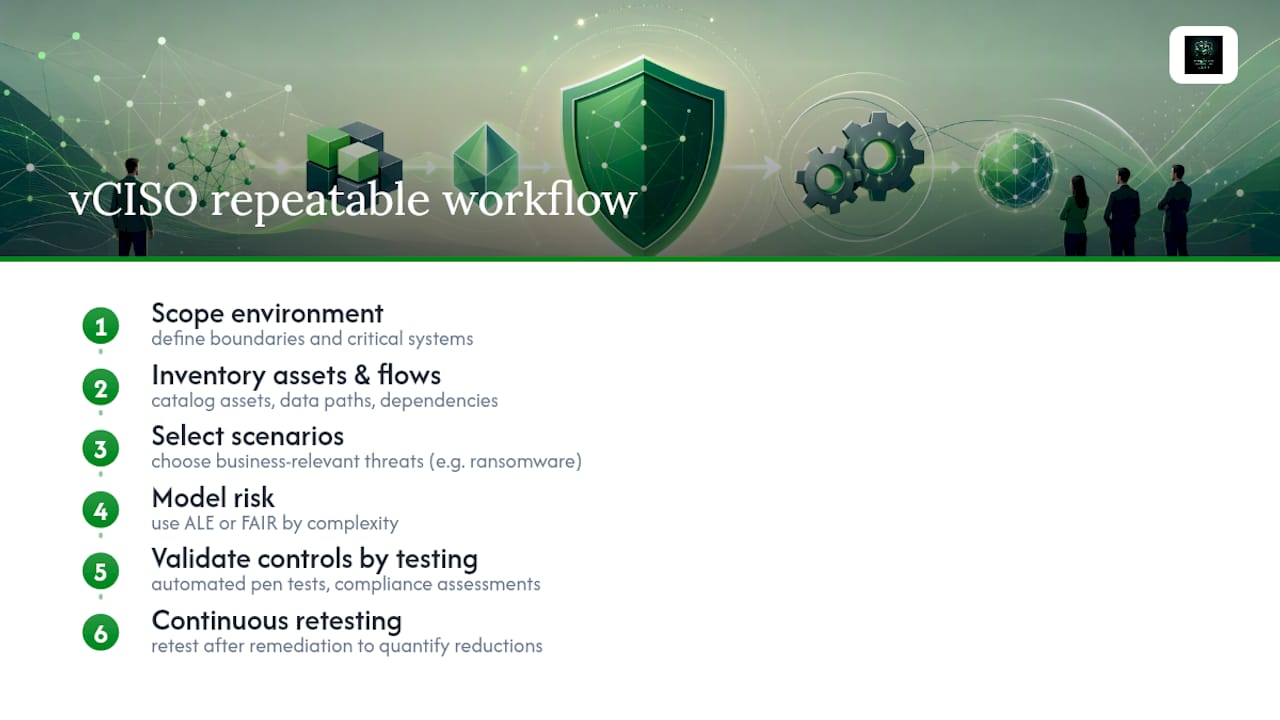
Building one ROSI model is an exercise. Building a repeatable process for producing them, scenario after scenario, quarter after quarter, is what a virtual CISO function actually does day to day.
The typical workflow runs: scope the environment, inventory assets and data flows, select the scenarios that matter most to that specific business (ransomware against OT systems in energy, client data exposure in law firms), model each one using ALE or FAIR depending on complexity, then validate the control-effectiveness assumptions through actual testing rather than vendor claims.
CisoSafe operationalizes that last step directly. Its platform automates penetration testing and compliance assessments across more than 50 regulatory frameworks, which means the control-effectiveness numbers feeding your ROSI model come from real test results, not marketing copy. Continuous retesting after remediation work converts technical fixes into quantifiable reductions in validated attack paths, a far stronger input than a one-time assessment. That combination of hands-on vCISO scoping and automated, repeatable testing is what turns a single spreadsheet exercise into a program a board can rely on year after year.
Why Transparent Models Beat Fear-Based Pitches
The conventional pitch for security budget still leans on fear: show the scariest breach headline, imply it could happen here, ask for money. That approach is losing ground, and it should. CFOs are trained to distrust anything that can't be stress-tested, and a fear-based pitch has no editable assumptions to interrogate.
The stronger move is the opposite of confidence theater: hand over a model with visible uncertainty built in, show the conservative case still justifies the spend, and let the CFO poke holes in it. A number that survives scrutiny is worth more than a number that only survives silence. That shift, from persuasion to transparent modeling, is the actual maturity curve security leadership needs to climb.
— vCISO
Get a Defensible ROSI Model Built for Your Organization
Building a stress-tested ROSI model by hand takes real analyst time, and getting the control-effectiveness inputs right requires testing most internal teams don't have the bandwidth to run continuously. CisoSafe closes that gap by pairing hands-on vCISO advisory with an AI-enabled platform that runs quantitative risk assessments and automated penetration testing, so the numbers feeding your model come from validated results instead of vendor promises.
This combination is particularly important for regulated, high-stakes organizations and compliance-sensitive mid-market companies, where boards or managing partners need defensible numbers for auditors and insurers beyond finance teams. Virtual CISO teams support scenario selection, ALE and FAIR inputs, and board-ready reporting alongside existing teams, often at a cost-effective rate compared to full-time CISOs or large consultancies. If you're ready to see what a defensible ROSI model looks like for your specific risk profile, visit CisoSafe to request a risk-quantification scoping call.
Sources
- NIST Cybersecurity Framework (CSF) 2.0 overview
- NIST SP 800-55 Rev.2: Information security measures guidance
- How to Quantify Cybersecurity ROI for the CFO (ValueNova)
- Transforming cybersecurity metrics into strategic business insights (ISACA)
FAQ
How do you calculate cybersecurity ROI?
Use the ROSI formula: (ALE before minus ALE after minus cost of control) divided by cost of control. You need annualized loss expectancy figures before and after the control, plus the fully loaded cost of that control.
What is the 80/20 rule in cybersecurity?
There's no single canonical version of a proportional rule specific to cybersecurity; it's generally used loosely to suggest that a small share of controls or vulnerabilities account for most of an organization's risk reduction. Treat any specific percentage you see attached to it with caution unless it's tied to your own incident data.
Is cybersecurity still worth it in 2026?
Yes, and the ROSI framework is exactly how to prove it internally: model expected loss avoided against control cost rather than relying on breach headlines, since a transparent, editable model consistently earns more budget trust than a fear-based pitch.
Can cybersecurity professionals earn $200,000 or more a year?
Senior roles like CISO, security architect, and specialized risk-quantification consultants can have high total compensation, particularly in regulated industries or major metro markets, though this varies widely by role, experience, and location. Extremely high figures are realistic mainly at the executive level in large enterprises or through equity-heavy compensation, not as a typical outcome across the field.
Should I use FAIR or simple ALE math for my ROI model?
Use straight ALE calculations for fast, directional prioritization on lower-stakes scenarios, and switch to the FAIR model when you need probabilistic precision for high-value, board-level decisions like ransomware exposure or major infrastructure investments.